Customer Journey
I believe that every company goes through a phase where they find themselves applying a lot of effort to guarantee a pleasant customer experience, however complaints just keep on coming. It was from this scenario that the customer journey project came to life.
We had frequent complaints, a low and inconclusive NPS score and the question that just keep coming to mind was “but where is the problem?”.
This initiative was done with Juliana Gallassi, now our marketing manager. We shared responsibilities equally, working as a team.
1
Breaking the Cycle
We’ve had experiences in the past trying to map out our customer journey, however they never came out as an effective tool for decision-making. It was when we came across Jim Kalbach’s book Mapping Experiences, that we had an insight of what may have gone wrong in the past: “the goal of mapping is to bring and outside view inside the organization”.
All of our previous tries were doing the opposite, looking only to our internal processes.
This became then our goal, create an internal awareness.

2
Finding a Direction
Our first step was to do an internal brainstorming to only get directions about where we could focus. This brainstorming involved those who had direct contact with the customer daily.
3
External Research
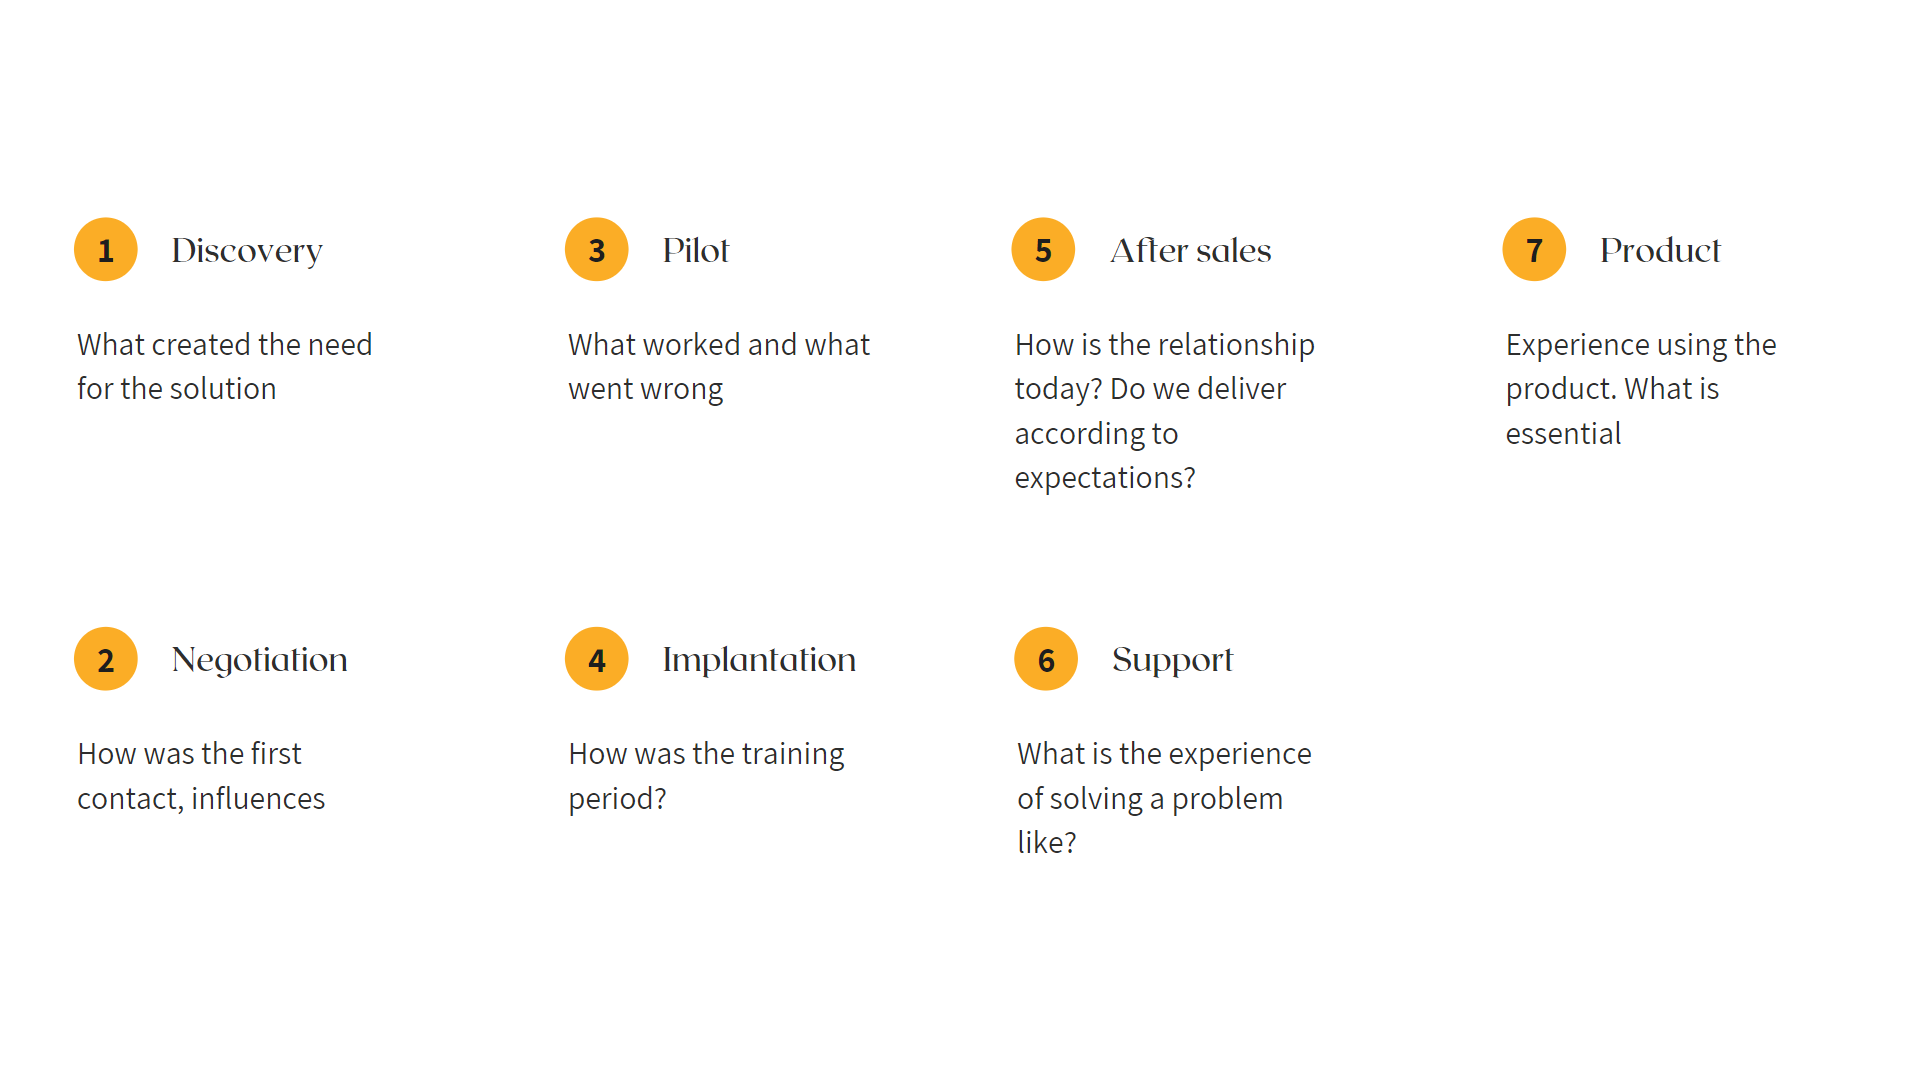
Since our goal was to bring an external view inside the organization, naturally our next step was to do customer interviews. We did about 10 remote interviews with customers with different characteristics. Our interview guide focused on each and every step of the journey the customer had to go through with us. The result of this work was the creation of two different personas and a large amount of qualitative data narrating the true experience customers had with the company.
4
Narrating the Experience
The challenge after that was to transform all the information gathered into a logic narrative of what the customer was telling us. For that, we made various sketches of blueprints on paper and on Whimsical.
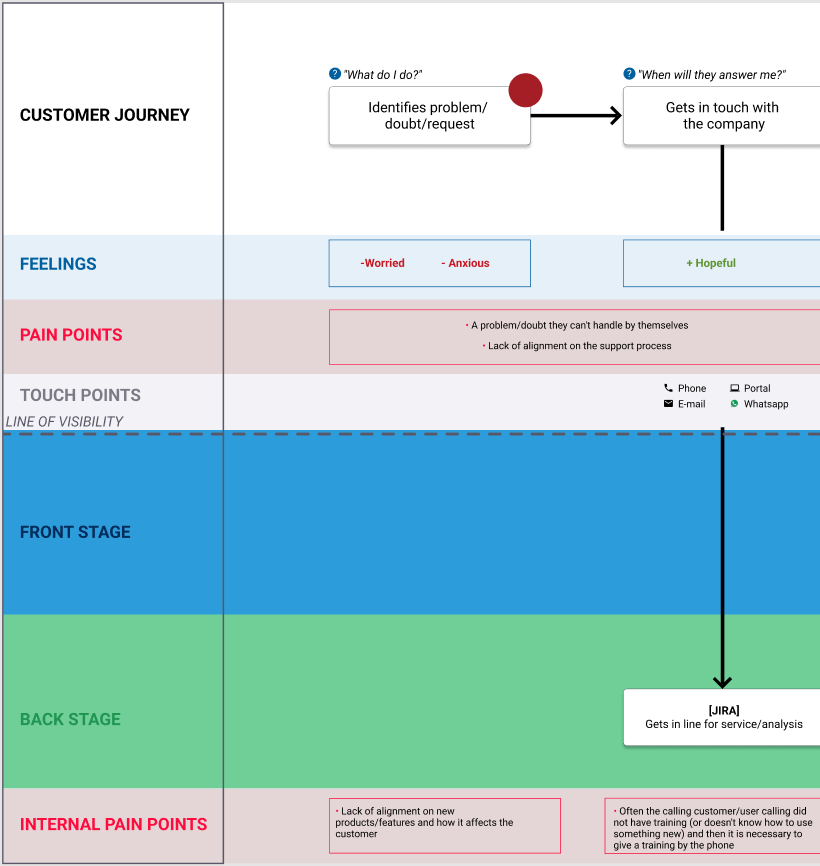
Since our goal was to create empathy, we decided to add to our blueprint customer emotions, pain points and communication channels. Also, we added quantitative information that showed the proportion of what the customer was talking about, example: “the support takes too long” - quantitative data: measure the average time of a service provided.
5
Our Blueprint
On the right, you can see an example of how our blueprint turned out. Besides the information already mentioned, on the most problematic phases, we also did an internal research to identify where the gaps were in our internal processes.
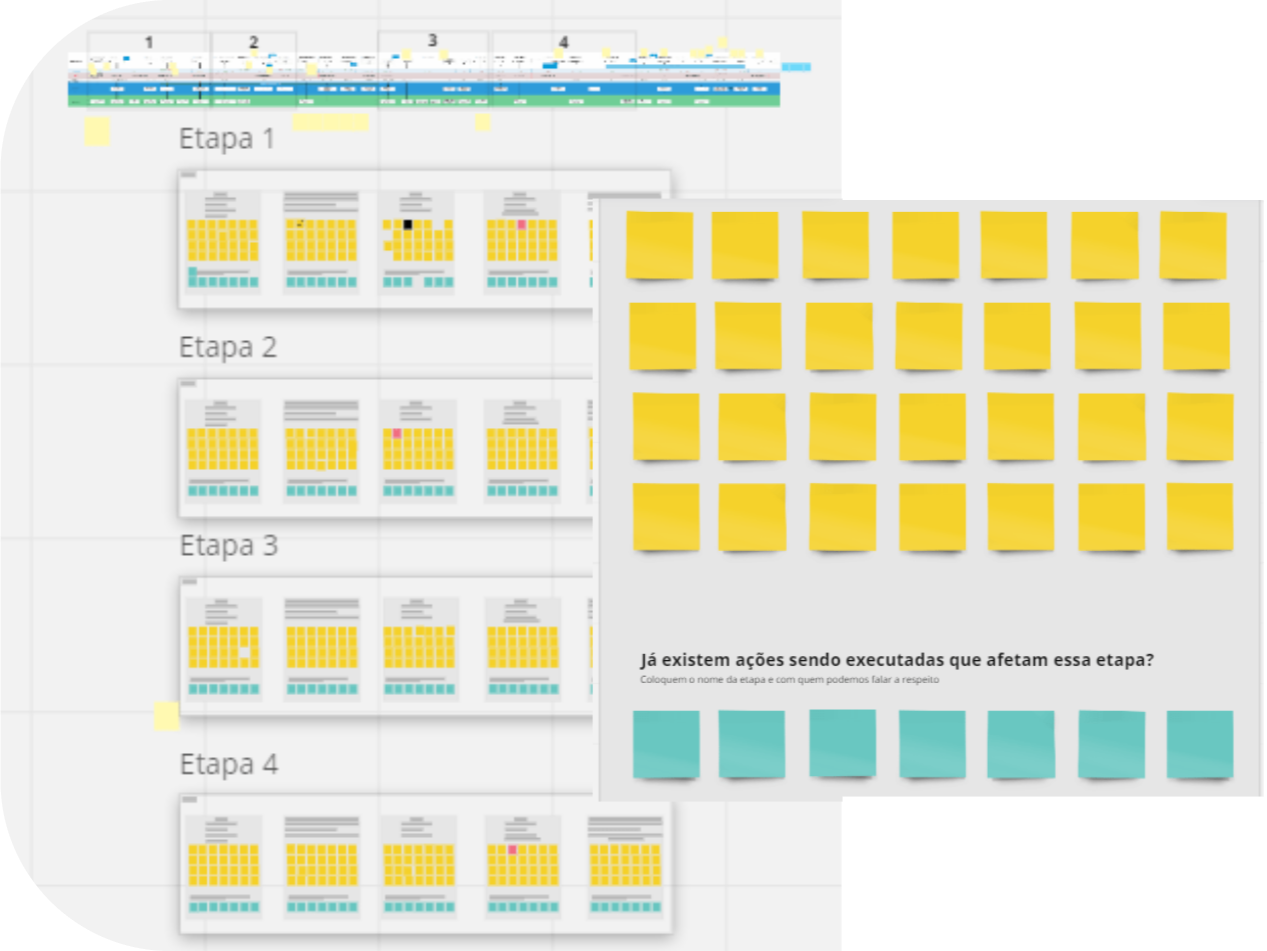
For this, we talked to about a hundred employees, creating an even bigger amount of quantitative data. To absorb all this and be able to “chew down” information, we codified the data. You can read more about this process in my medium article (in Portuguese).
6
Ownership
We understood that only sharing the blueprint wouldn't be enough, that's why for the next step we focused on creating a sense of ownership on company leaders.
One of the actions done was to do a workshop focused on identifying improvements that we could apply to the customer journey.
7
Prioritizing
At the end of the workshop, we had many ideas of what could be done. To be able to focus on what would bring us more significant results on the first moment, we prioritized actions based on their development effort and also by the following questions:
- Which phases of the journey does this have an impact on?
- Is it related to the biggest pain points?
- Does it affect existing or new customers?
- How many departments have to be involved?
- Is it something strategic?
Conclusion
Among the main results of this work, we can highlight:
- Internal awareness of what is the true customer experience;
- Reference to the journey blueprint in many meetings, optimizing discussions;
- Creation of a customer-centric culture;
- Change in the on-boarding stage of new customers.


